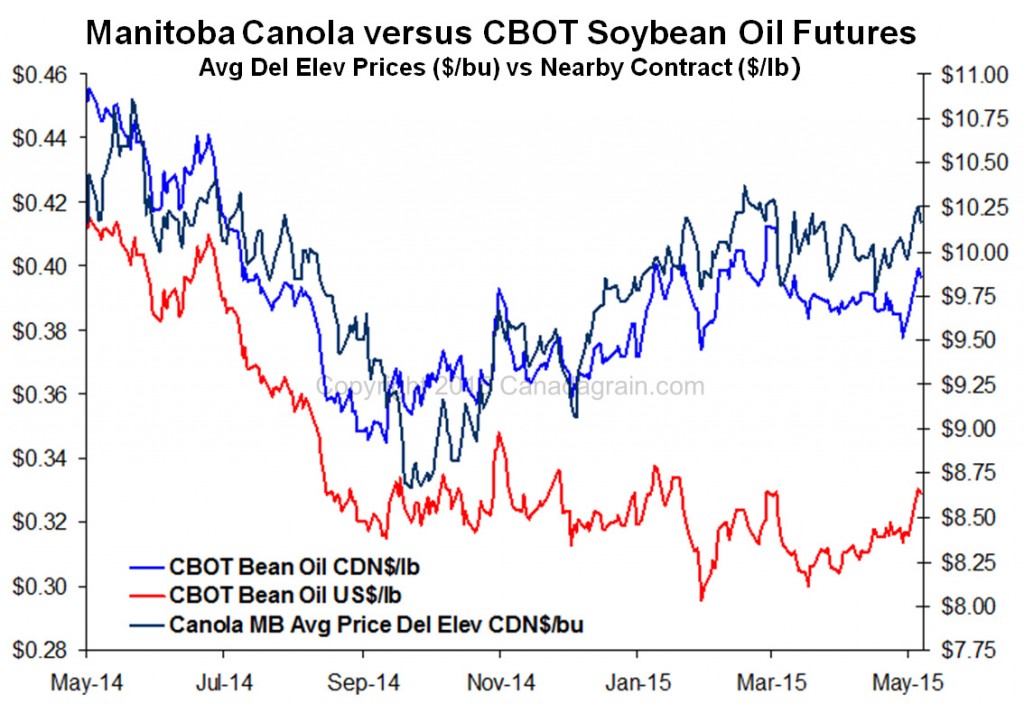
Marketing Trend Charts
Charts – a pictorial history of markets – can be a powerful decision making tool. Patterns repeat. A seasoned analyst can tell a lot about what is likely to happen in a particular situation, based on chart patterns. Prairie Crop Charts is a subscription based chart service covering the major grain and special crops grown on the Prairies.
In any market, knowing what is likely to happen is a big edge. Most commodity spec funds, for example, trade on charts. If charts work for billion dollar hedge funds, odds are they may provide you a hand when you’re marketing your 10,000 bushels of lentils. For a farmer, charts can be a helpful marketing tool.
Updated weekdays, Prairie Crop Charts covers the major grains and special crops grown on the Prairies: canola, oats, wheat, barley, flax, soybeans, red lentils, green lentils, brown mustard, yellow mustard, oriental mustard, canary, green peas, yellow peas, chickpeas, edible beans and more. Summaries and links to the most recent crop charts, analysis and commentary follow below. 
[C] Chart provided courtesy of Prairie Crop Charts.